9
April
Thu
Webinars 7:00pm
April
Thu
Webinars 7:00pm
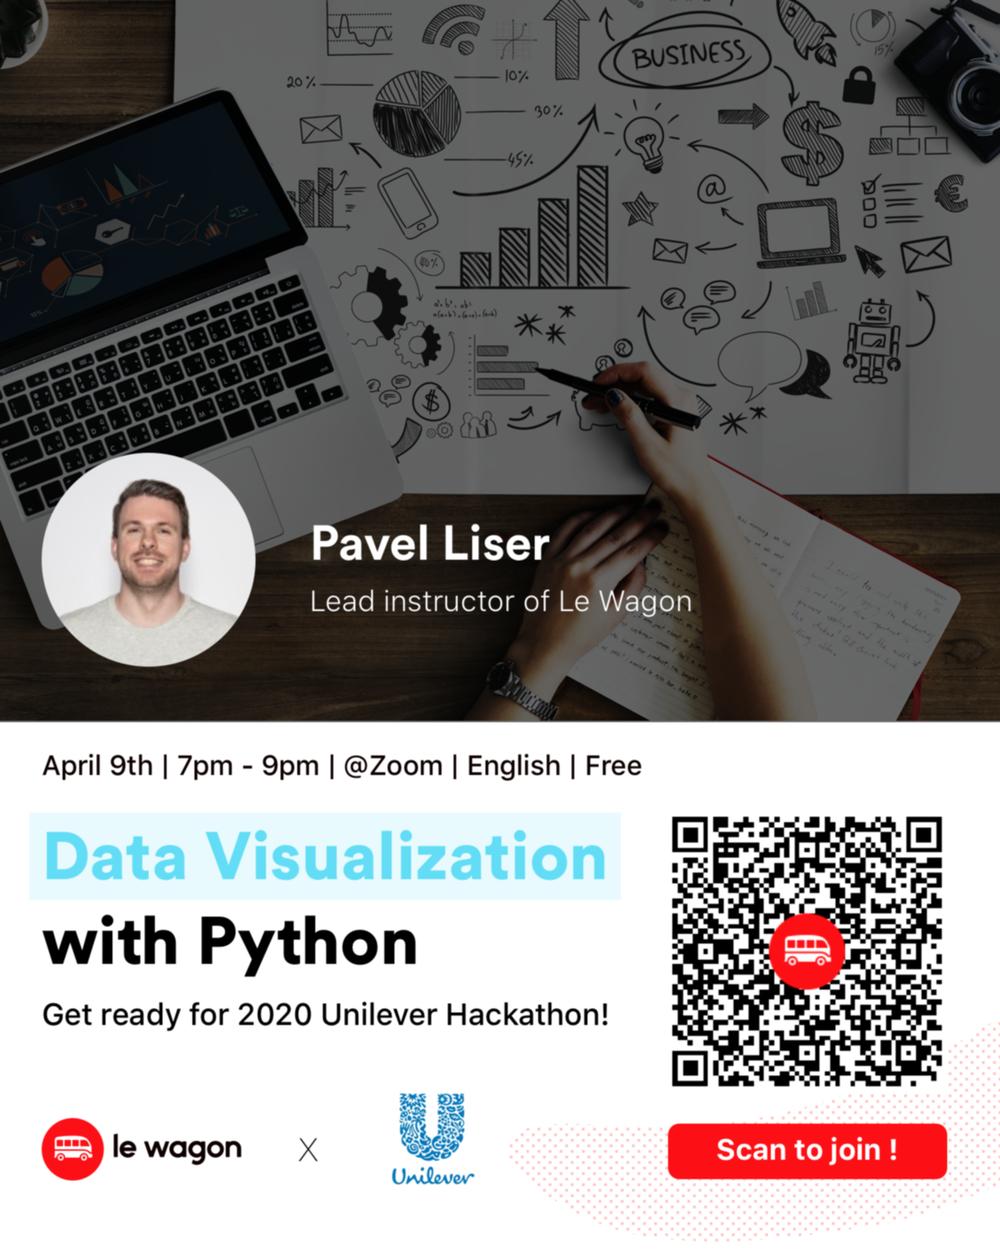
Data Visualization with Python
描述
***Scan the QR code or add WeChat ID: fiona_jyy to join the online learning group!
When we watch reports or presentations, we naturally first look at the graphs and charts. Data Visualization is a key aspect of anyone working with Data Science or Analytics, as it helps you not only locate trends and insight, but also present your findings in a compelling way. And to stay relevant with a world buging with data, we need a better tool than Excel - Python.
Join our online workshop on April 9th to learn about Visualization with Python, as we will explore data on startup investments over the years using Data Scientist tools.
About Le Wagon
Le Wagon is an international coding bootcamp.